Dashboards & Reporting
Data you can act on, not just look at.
How was last month? Who's your top instructor? Are you actually making money on equipment rental? Five dashboards answer the questions a spreadsheet — or three — would take you all weekend to figure out.
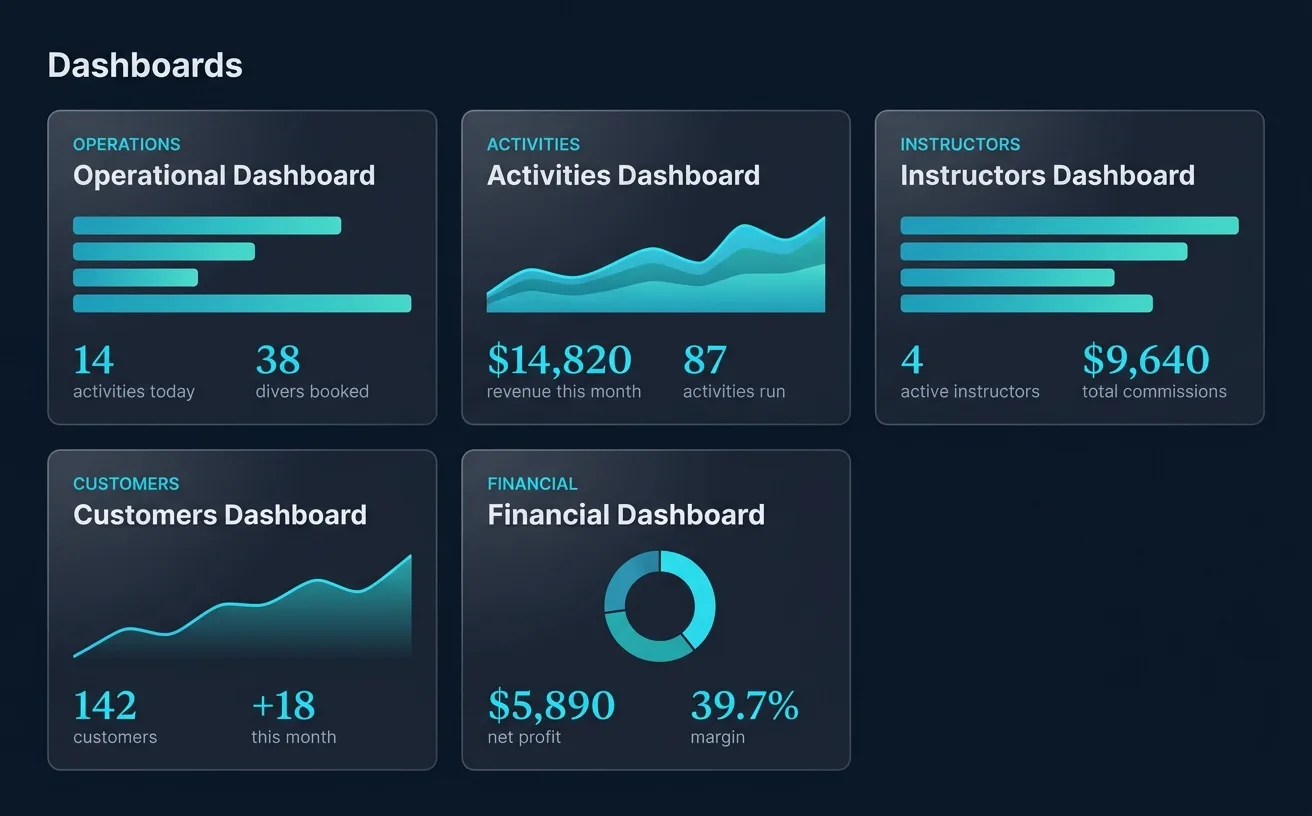
Open the one you need, see where you stand
Money, activities, staff, customers, the day's operations — each has its own screen. Open it and you know where the shop stands, without stitching together a spreadsheet to find out.
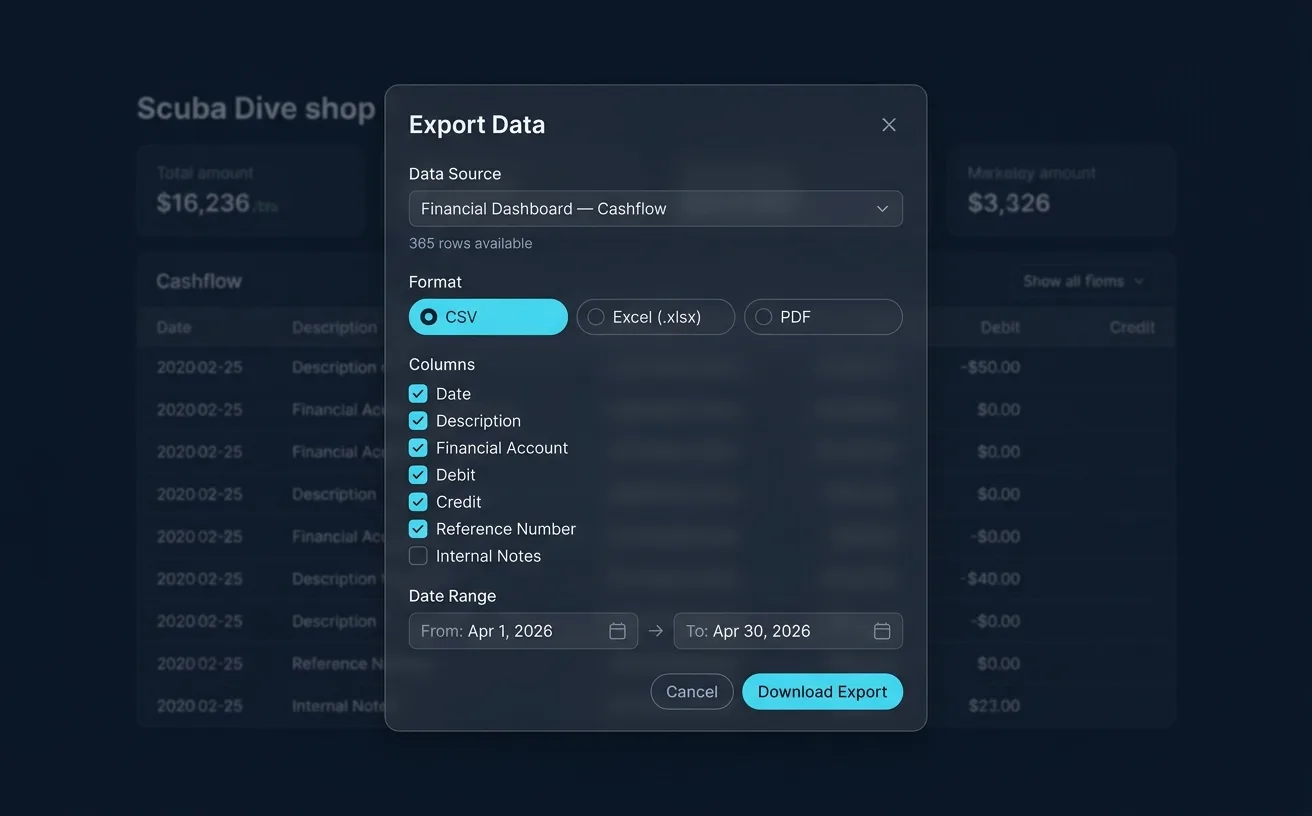
Export anything
Every chart and table drops into Excel in one click — for your accountant, your partner, or your own records. No copy-pasting, no rebuilding it by hand.
What each one tells you
Each dashboard is built around a question you already ask — plus one control to ask it about any stretch of time.
Operations
What's happening today — every booking, dive, and sale across the shop on one screen.
Financial
Are we making money? Revenue against expenses, cashflow, what's still owed, and where the day ended.
Activities
Which courses and dives actually fill up — and when your busy season really hits.
Instructors
Who taught what, who earned what, and who still has room for more.
Customers
New faces, returning divers, and the certifications they're working toward.
Any date range you need
Check any week, month, or season on every dashboard — this month, last high season, or the whole year.
Stop managing your dive center from a spreadsheet.
Set up your free account in 2 minutes. No credit card required.